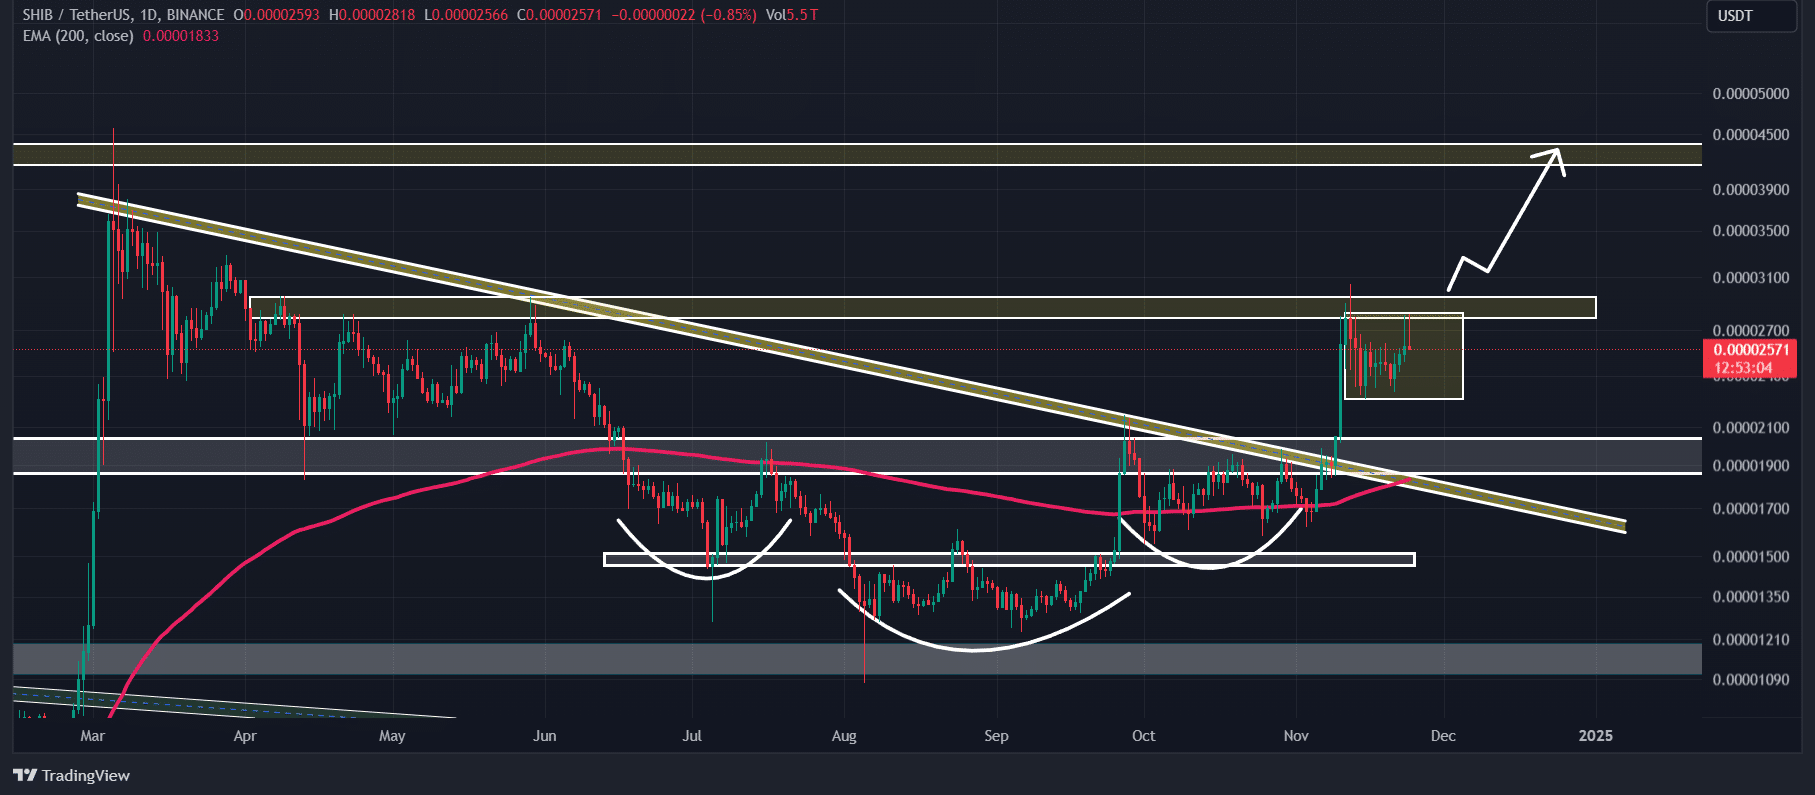
- SHIB could surge 50% to reach the $0.000044 level if it closes a daily candle above $0.0000295.
- Combining on-chain metrics with technical analysis suggests traders are confused.
Amid the ongoing bull run, Shiba Inu (SHIB)the second largest coin, has been in trouble since November 12, after a major breakout of the descending trendline.
However, data from an on-chain analytics firm suggests that whales and institutions are showing strong interest in the meme coin, leading to massive accumulation.
Shiba Inu whales increase their holdings
IntoTheBlock, the on-chain analytics company, reported that whales and institutions holding between $1 million and $10 million worth of SHIB tokens increased their holdings by 425% over the past 30 days. This demonstrates strong institutional interest during this consolidation phase.
This development means that the big players are preparing for a possible breakout. Additionally, this hints at potential buying opportunities and upside recovery in the coming days.
SHIB Technical Analysis and Key Level
According to expert technical analysis, SHIB is currently consolidating within a very tight range, close to a strong resistance level of $0.000029. Consolidation near a resistance level is often seen as a potential buy signal, as traders and investors use this level to accumulate tokens.
Based on recent price action, if SHIB breaks out of this zone and closes a daily candle above the $0.0000295 level, there is a high possibility that the meme coin could surge by 50% to reach 0.0000295. 000044 $ in the coming days.
Currently, SHIB is in an uptrend as it is trading above the 200 exponential moving average (EMA) on the daily time frame. Meanwhile, its relative strength index (RSI) suggests potential bullish momentum in the coming days, with its value still below overbought territory.
Mixed sentiment about on-chain metrics
Despite the bullish technical analysis, SHIB’s on-chain metrics show mixed sentiment among traders. According to Coinglass, the meme coin’s open interest (OI) dropped by 10.25% in the last 24 hours.
This decline in OI suggests that traders are liquidating their positions as the price continues to consolidate.
Right now, the main liquidation levels where traders are overleveraged are at the bottom $0.00002546. At this level, traders built long positions worth $1.8 million.
Conversely, $0.00002861 sits at the upper end, where traders have built short positions worth $3.6 million.
Combining these on-chain metrics with technical analysis, it seems that traders are confused. They could also wait until the consolidation exits.
Is your wallet green? Discover the SHIB Profit Calculator
At press time, SHIB was trading near the $0.000026 level and saw a 5.20% price decline over the past 24 hours.
During the same period, its trading volume fell by 17%, indicating lower trader participation compared to the previous day.


