 Poised for 18% Rally, The Reason")
Shiba Inu (SHIB), the popular and second largest cryptocurrency coin, is poised for a price rally as it has formed a bullish price action pattern on its four-hour time frame. Additionally, overall market sentiment appears to be shifting from a bearish to an uptrend with SHIB appearing to break out of its extended consolidation or channel pattern.
Shiba Inu (SHIB) Technical Analysis and Upcoming Levels
According to expert technical analysis, SHIB appears bullish as it is currently at the bottom of the channel pattern, or the lower boundary of the consolidation zone, where it has been for the past 32 days.
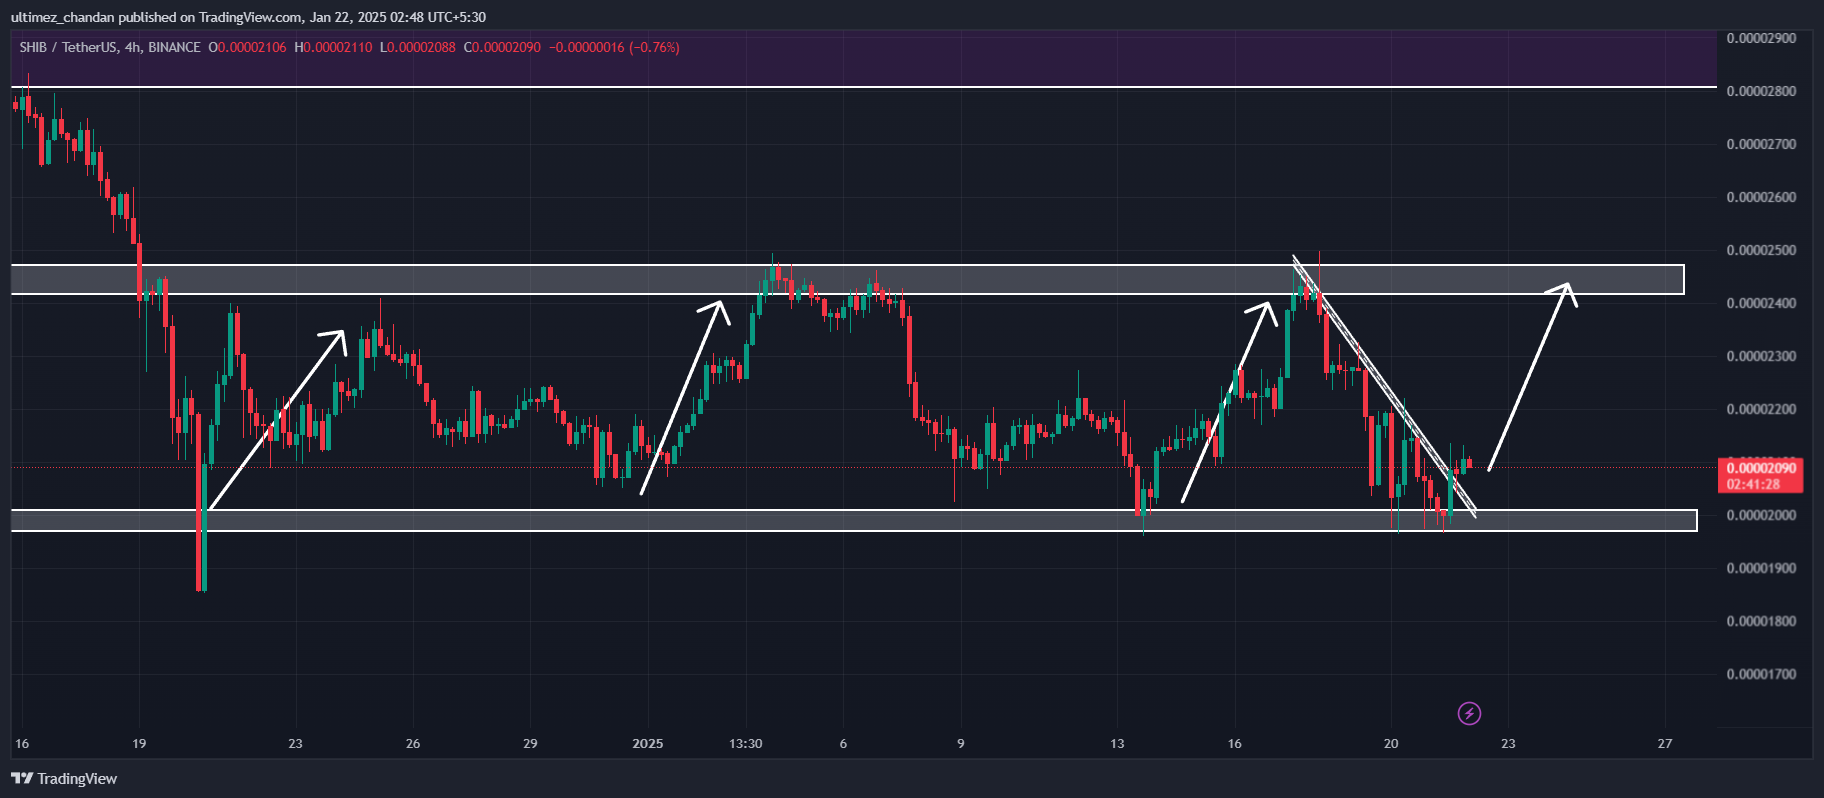
The SHIB daily chart reveals that the meme coin is trading in a range between $0.00002013 and $0.00002466 and is currently at the lower boundary of this zone.
Looking at the SHIB four-hour chart, it appears to be the fifth time the meme coin has moved lower. Based on recent price action and historical price momentum, there is a strong possibility that it will surge by 18% to reach the $0.00002466 level in the coming days.
On the positive side, with SHIB’s Relative Strength Index (RSI) at 44.37, this indicates a bullish signal and hints at a potential price reversal and bullish momentum.
$32 million in SHIB exits from exchanges
However, given the bullish price action and potential bullish momentum, long-term holders appear to be accumulating the token, as revealed by the on-chain analytics firm. CoinGlass. Spot inflow and outflow data shows that exchanges experienced an outflow of SHIB worth over $32 million in the last 48 hours.
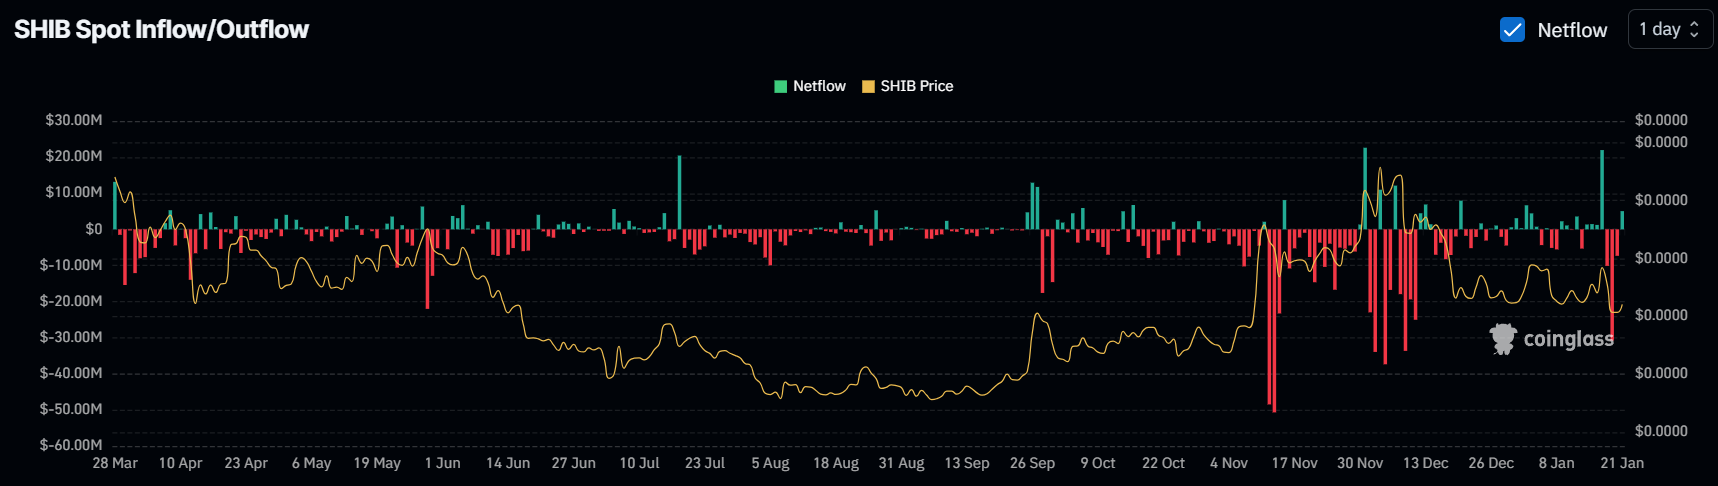
These substantial outflows hint at potential accumulation, as outflows refer to the movement of assets from exchanges into investors’ portfolios. This also suggests a potential buying opportunity, upside potential, and buying pressure ahead.
Combining this on-chain measurement with technical analysis, it appears that bulls have started to dominate, helping the meme coin reach the upper limit of the consolidation zone.
Current Price Dynamics
Currently, SHIB is trading near $0.000021 and has seen a price drop of over 1.85% in the last 24 hours. During the same period, its trading volume fell by 58%, indicating less participation from traders and investors compared to the previous day.