 Sees 10x Volume Increase, Shiba Inu (SHIB) Stuck Between Key Levels, Solana (SOL) Breakdown: Is $300 on the Horizon?")

Disclaimer: The opinions expressed by our editors are their own and do not represent those of U.Today. The financial and market information provided on U.Today is intended for informational purposes only. U.Today is not responsible for any financial losses incurred while trading cryptocurrencies. Do your own research by contacting financial experts before making any investment decisions. We believe all content to be accurate as of the date of publication, but some offers mentioned may no longer be available.
The trading volume of Ethereum, the second largest cryptocurrency by market capitalization, has increased significantly recently. This significant rise is a sign of increased market activity as it implies more active participation from traders and investors. Even if the price of ETH has recently fallen, there are indications that it could be ready for a comeback and even another rally.
Ethereum, currently trading at around $3,632, just crossed its 50-day exponential moving average (EMA), a crucial resistance level that, when crossed, frequently serves as a bullish indicator. The asset’s bullish structure on the daily chart was reinforced by constant support above the 26 EMA.
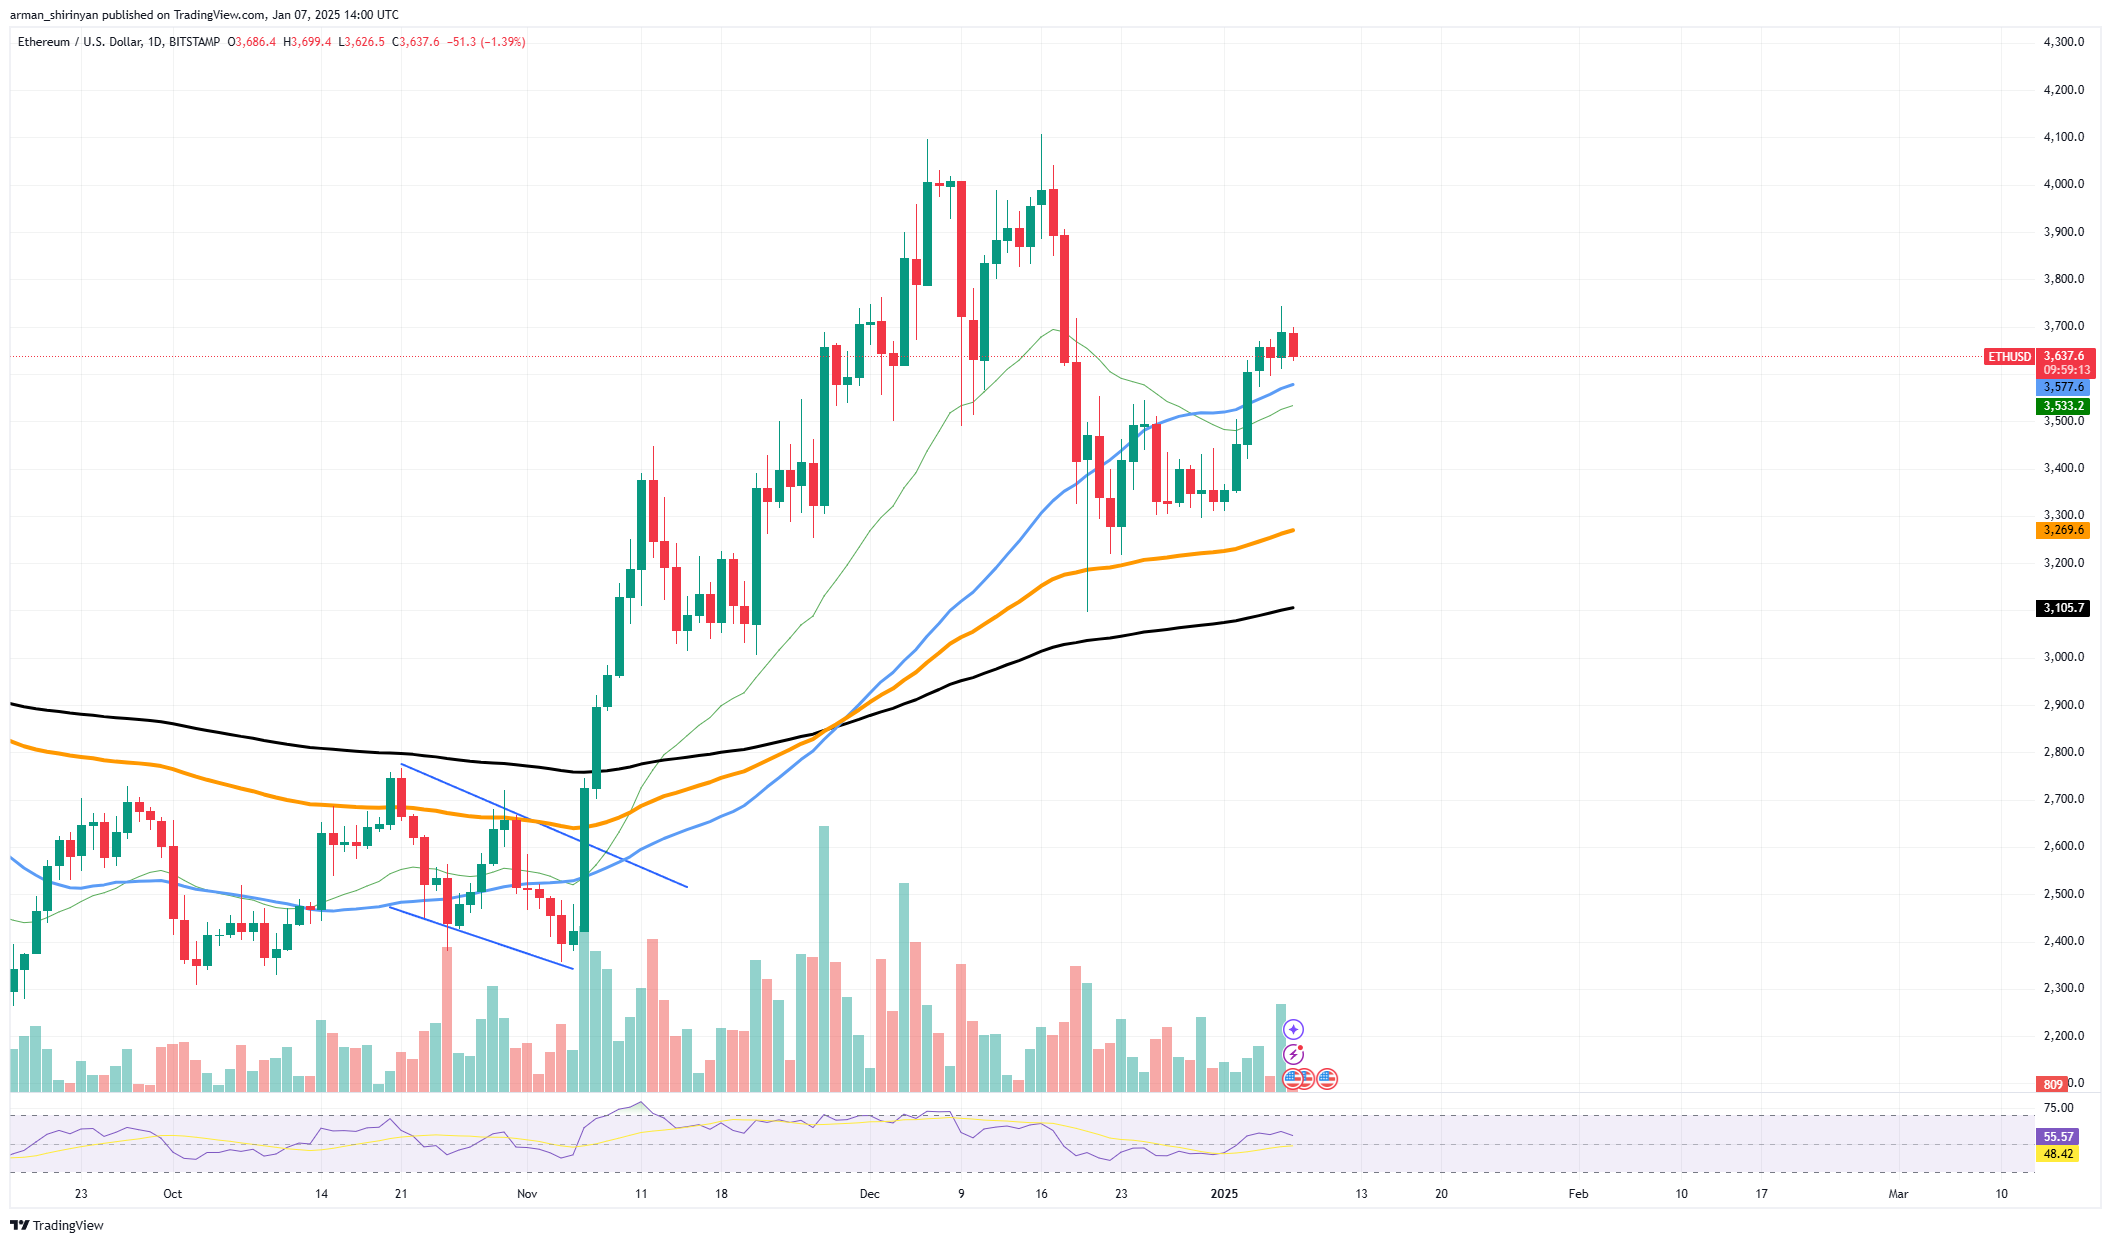
Holding these technical levels could pave the way for a rally towards the $3,800 psychological resistance zone, making them important for traders. Significant capital is reportedly flowing into Ethereum as indicated by increased trading volume, which is a clear indication of market interest.
The Relative Strength Index (RSI) is trading in the neutral zone of 55, which is significant despite the increase in volume. This implies that there is still potential for ETH increase without reaching an overbought situation. Ethereum enjoys strong downside support at $3,500, supported by the 26 EMA as well as the recent spike in buying activity. This could provide a solid foundation for the next stage of the rally if this level holds.
ETH could return to the $3,300 mark, where the 100 EMA provides an additional safety net if this support is not maintained. Ethereum market sentiment remains cautiously optimistic. A large number of market participants are likely betting on a bullish scenario based on increasing trading volume. The asset must, however, decisively exceed $3,800 in order to validate the continuation of its upward trajectory. Ethereum could reach the next important resistance level of $4,000 and above in the event of a successful breakout.
Shiba Inu is under pressure
The Shiba Inu is currently going through a difficult market phase as it is stuck between important support and resistance levels. Currently trading at $0.00002375, the asset is in a tight range that could determine its near-term future as it has not made any notable moves in recent sessions.
At $0.000025, a critical resistance level, SHIB is holding just below its 50-day exponential moving average (EMA). As a ceiling for SHIB’s price action, this level has proven difficult to breach. On the other hand, the 100-day EMA at $0.00002220 was a vital source of support to end further declines. Due to these circumstances, SHIB now has a limited trading range and market participants are carefully monitoring its next move.
Related

The lack of clear guidance highlights the market’s current hesitancy about SHIB’s immediate prospects. The obvious decline in trading volume is one of the main problems SHIB is currently facing. The asset may struggle to break out of its current range due to the lack of strong buying or selling pressure indicated by this drop in activity. The relative strength index (RSI), which measures market momentum without obvious bullish or bearish sentiment, is also hovering around 49.
At the crossroads, Shiba Inu finds itself caught between two crucial turning points which could determine its evolution in the days to come. SHIB price action is likely to remain erratic and unpredictable until it breaks out of this range.
Since a breakout of either level could determine the direction of SHIB’s next big move, traders should keep a close eye on the $0.00002220 support level and the 0 resistance level $.000025.
Solana needs more
Recently, Solana broke a significant descending trendline, suggesting that price action may be about to reverse. The asset is still struggling to rise above the crucial resistance at the 50-day exponential moving average (EMA), which currently sits at $218, despite this bullish technical signal.
Related

GROUND was kept in a downtrend for months by the descending trendline, which served as resistance. Generally, a crossing of this line indicates bullish sentiment and possible bullish momentum. The 50 EMA is Solana’s next significant hurdle, but this breakthrough was not accompanied by sufficient buying pressure or trading volume. This could open the door for a rally towards the next resistance level at $240 if Solana manages to break above the 50 EMA.
On the other hand, the 26 EMA provides strong support for Solana around the $200 mark. The asset could return to $178, where the 100 EMA offers more support if this support is not held, reigniting the bearish sentiment. Among the most alarming indicators is the lack of significant volume that accompanied this trendline break. If commercial activity does not increase significantly, the sustainability of this development remains uncertain.