
Crypto analyst Balo (@btcbalo) has highlighted a major technical breakout on the Dogecoin (DOGE/USD) chart that suggests an uptrend in the near future. Balo’s analysis, based on a 4-hour chart, highlights several key technical developments that raise expectations for continued upward movement in the price of Dogecoin.
Why Dogecoin looks ready to rally
The cornerstone of Balo’s assessment focuses on Dogecoin’s decisive break of a long-standing downtrend line on December 28. This downtrend line, initially established from the December 8 high of $0.48, had served as a formidable resistance level, effectively dictating DOGE’s price movements throughout December.
Related reading
The break above this trendline marks a critical turning point. Following this ascent, Dogecoin experienced a minor retracement during which memecoin quickly retested the broken trendline. However, the retest was successful, strengthening the bullish outlook for Dogecoin.
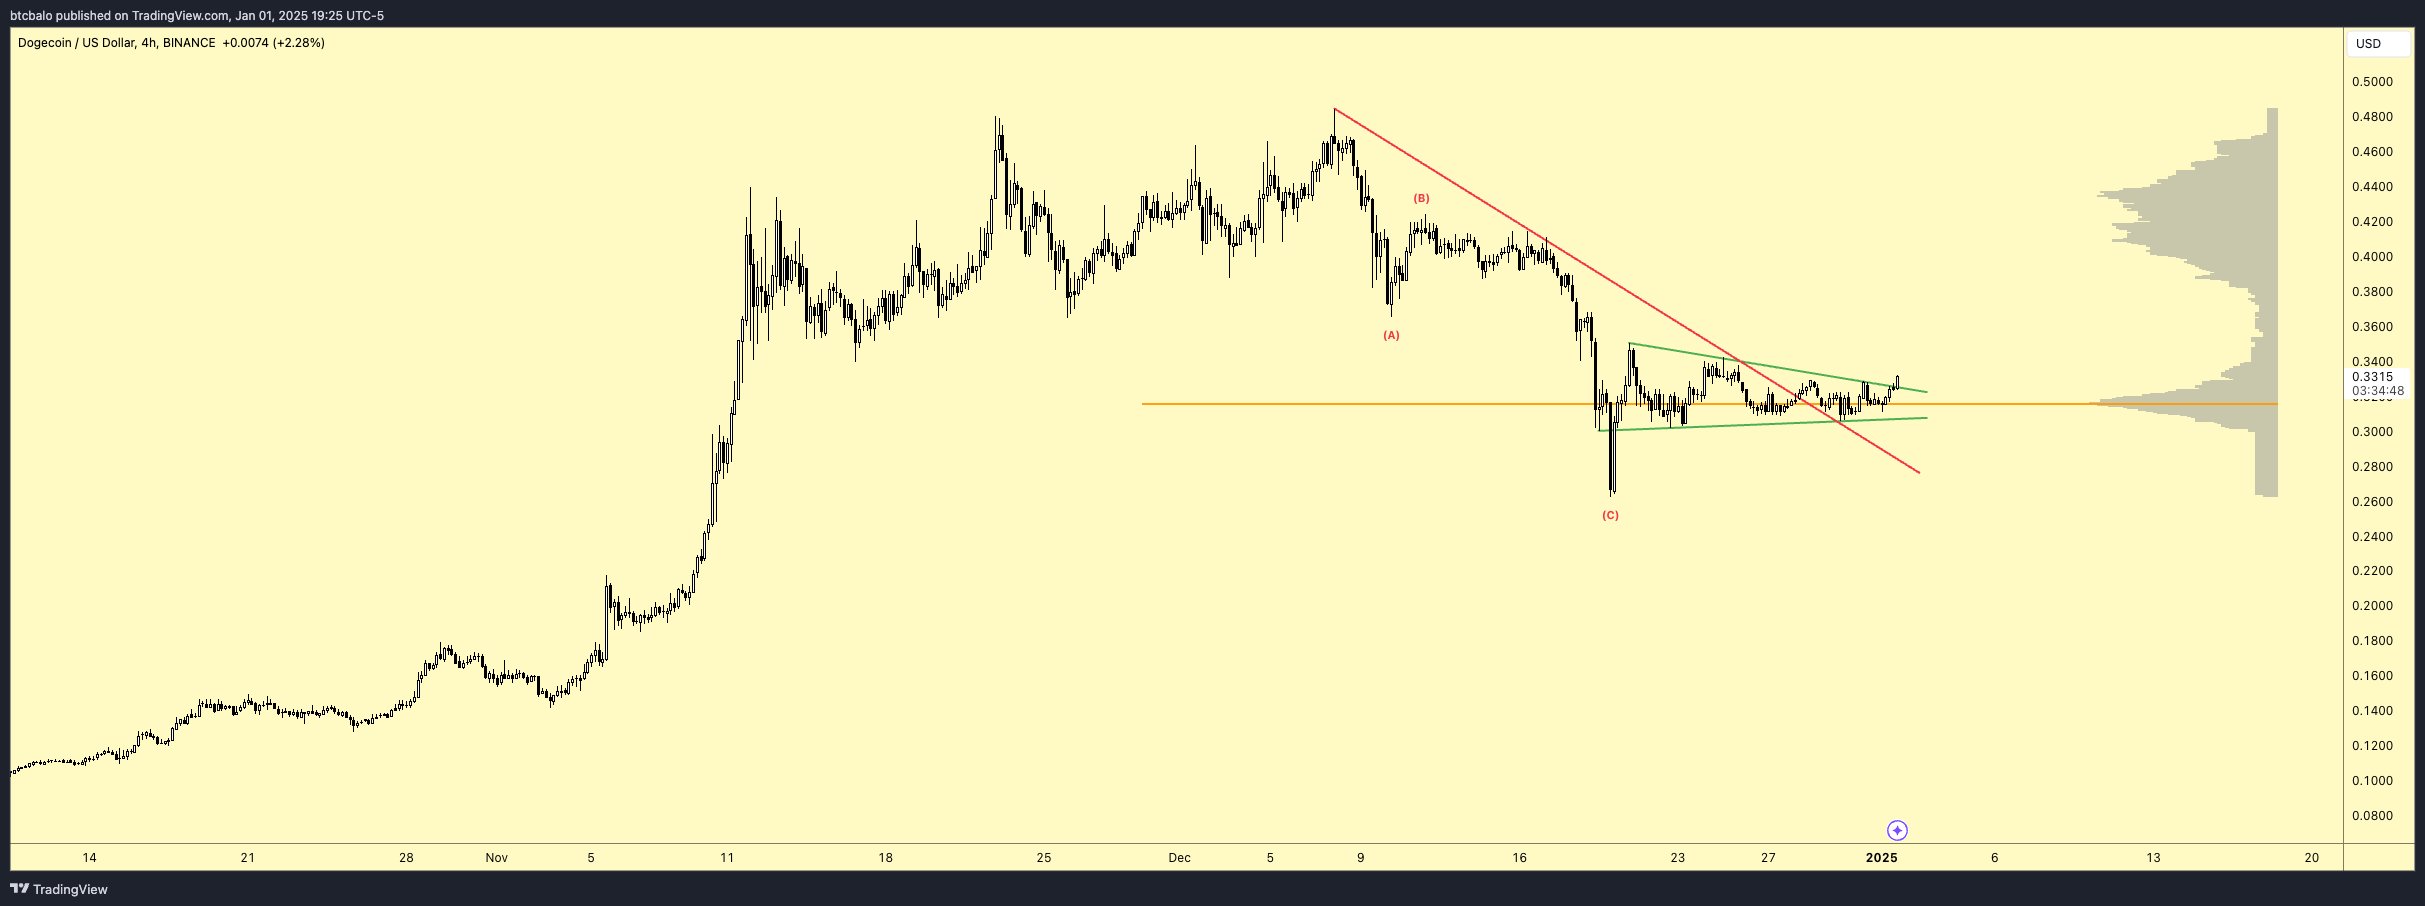
Completing the break with the downtrend The line is the dissolution of a descending triangular pattern that had formed since December 21. A descending triangle is characterized by a series of lower highs converging with a relatively flat support level, often signaling a potential bearish continuation.
However, Dogecoin’s ability to break out of this formation today, January 2, suggests a change in market sentiment. The emergence of the descending triangle, coupled with the breakout, reinforces the bullish narrative, although a retest of the triangle’s upper boundary could provide further validation of this bullish trend.
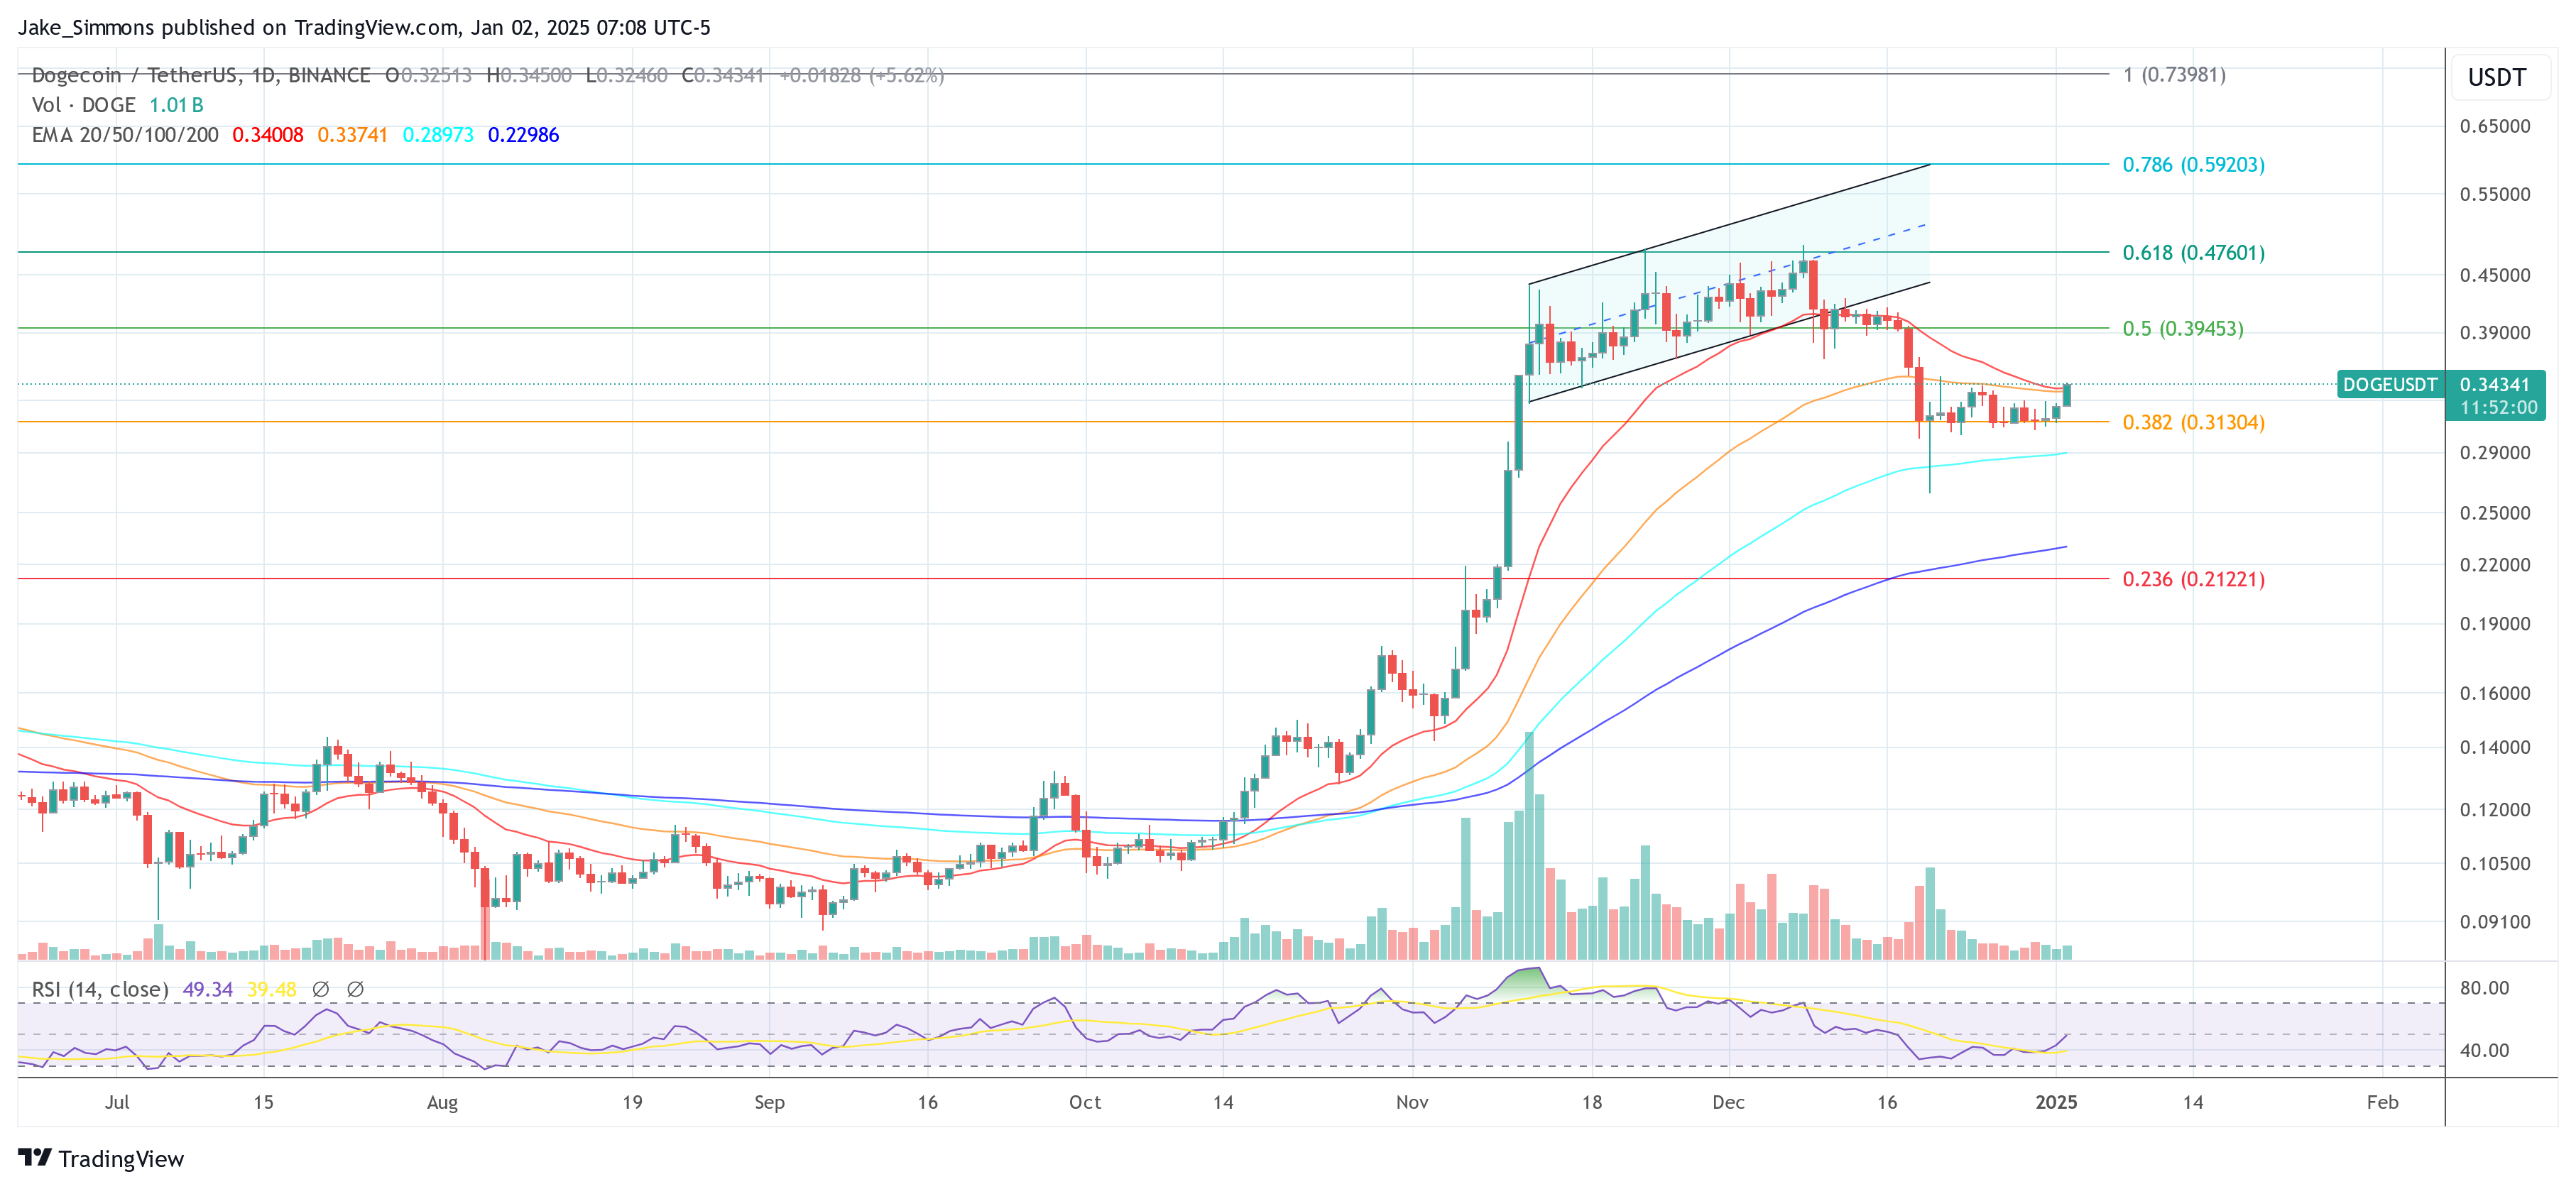
The volume profile, which offers a nuanced understanding of trading activity at different price levels, is also integral to Balo’s thesis of a major breakout. Dogecoin rebounded from substantial support from the highest volume cluster around $0.32, indicating a solid base of accumulated commercial interest.
Related reading
On the upside, volume is low up to the $0.40 region, where there is a huge cluster up to $0.43. This grouping implies that above this area, DOGE could encounter minimal resistance, paving the way for Dogecoin to target its yearly high of $0.4834, recorded on December 8.
The completion of the ABC pattern on the Dogecoin chart further strengthens the bullish outlook. The ABC pattern is a corrective sequence in technical analysis that usually signifies the end of a retracement phase and the continuation of the previous trend. In the case of Dogecoin, the finalization of this model aligns perfectly with the others bullish indicators derived from distribution and volume profile analysis.
Thus, Balo’s remark “DOGE (starts) to break out, I see no reason to stop now.” New highs very soon,” could signal that DOGE is heading towards a new high.
At press time, DOGE was trading at $0.34.
Featured image created with DALL.E, chart from TradingView.com